
The Dispatch Overview and Analytics tabs help you monitor your performance by showing you all the data you need - areas where your team is crushing their deadlines and which areas need improvement.
Dispatch Overview
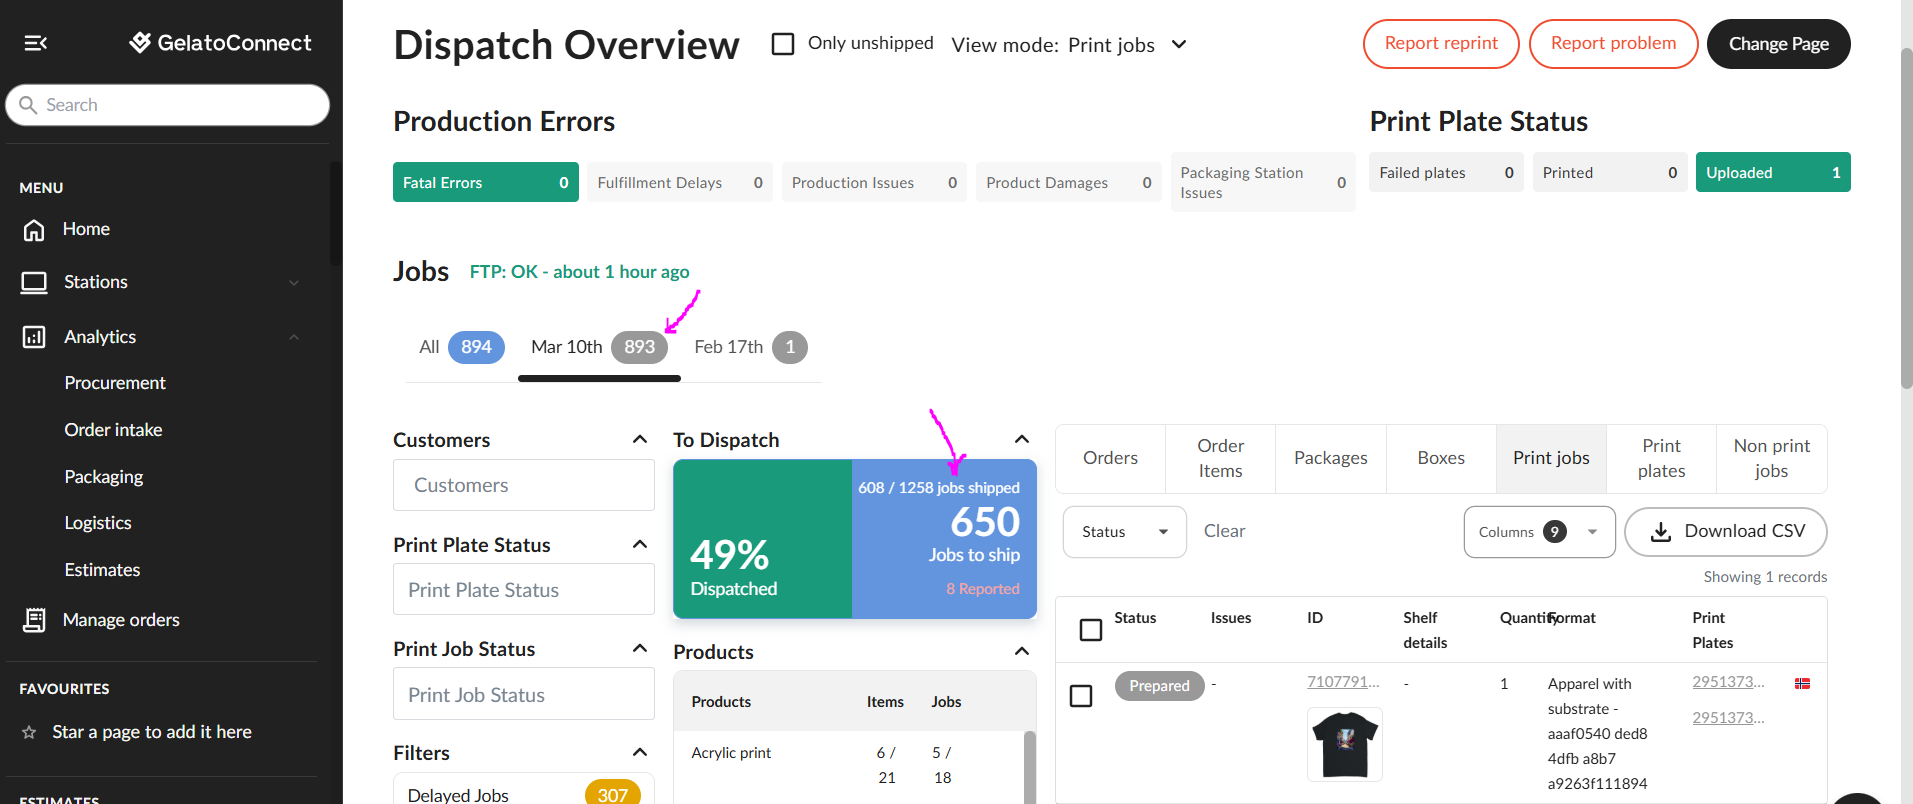
Dispatch Overview helps you understand which products need your attention, which orders are delayed, and what should be your focus today.
You can see right away how many orders need to go out the door in the given day, and your team can track progress in real time. They see that their hard work makes a difference and how many packages still need to be shipped.
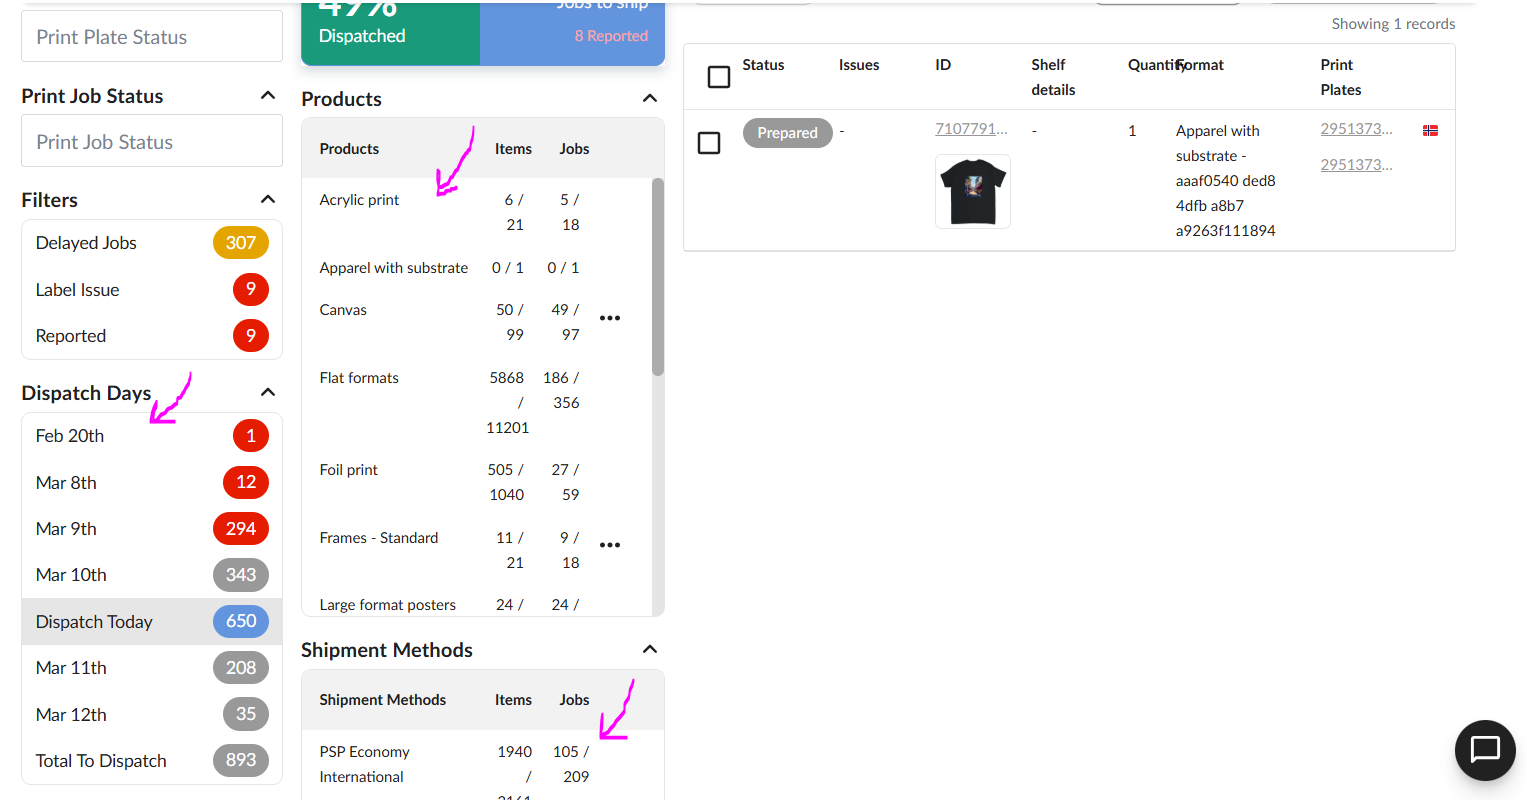
Many filtering options allow you to check the progress per day, product, or even a shipping method:
For each day, you'll see three key numbers:
Shipments Due: What should have gone out
Shipped: What actually went out
Remaining: The gap (and potential problem)
A pattern of "remaining" orders on specific days often reveals capacity issues.
Analytics - Order Intake
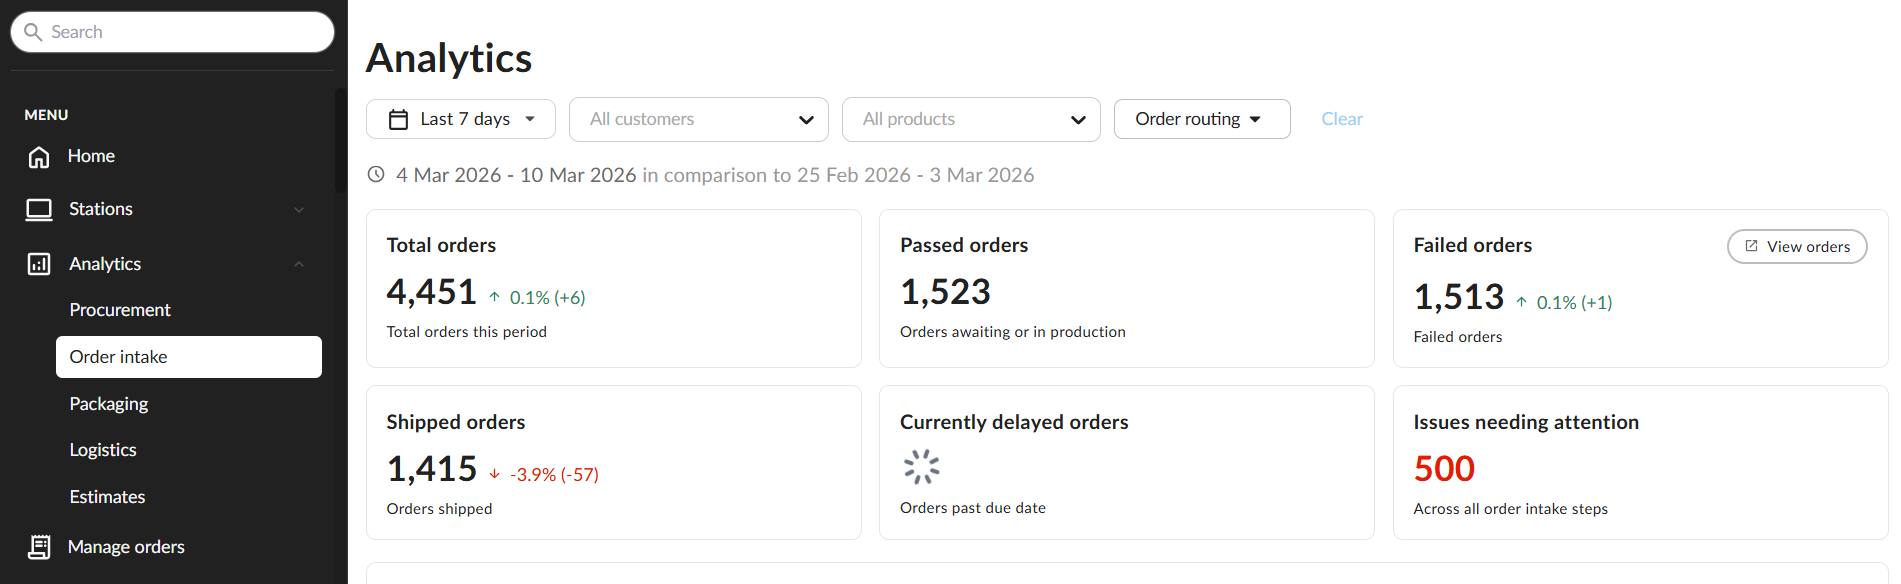
The Order Intake tab under Analytics gives you an overview of all of the orders in a given timeframe (that you can adjust as you wish).
Main categories:
Total orders - sum of all orders
Passed orders - orders that are in production
Failed orders - orders that failed and haven't reached production
Shipped orders - dispatched orders
Delayed Orders - orders that are past the SLA
Issues needing your attention - failed print jobs, requests, or postbacks
Issues needing attention overview:
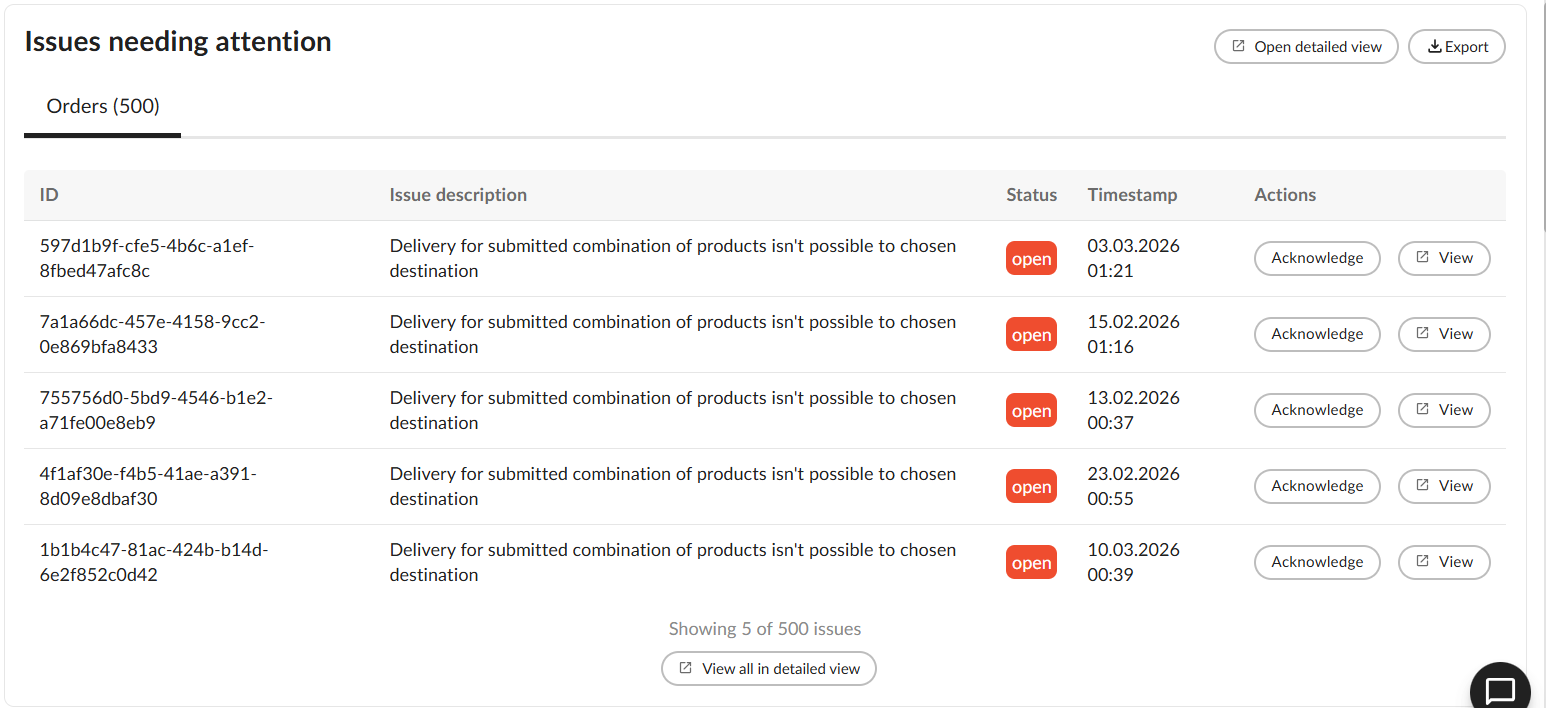
In the overview, you can see the list of all errors that currently affect your orders with links to the exact request, job, or postback. This way, you can work on issues in one place instead of looking for them manually.
With this report, you can also see which areas are the most problematic and what needs to be improved to avoid them.
Order analytics
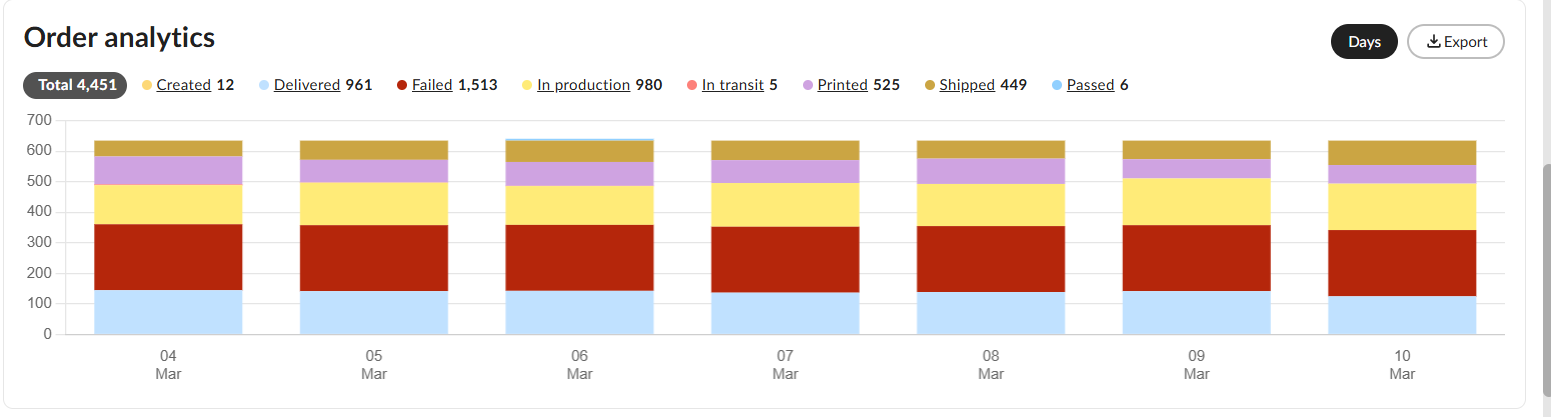
See how many orders per day are shipped, failed, or received - adjust your team work by understanding which area needs focus and which days are the busiest.
Item volume by product model
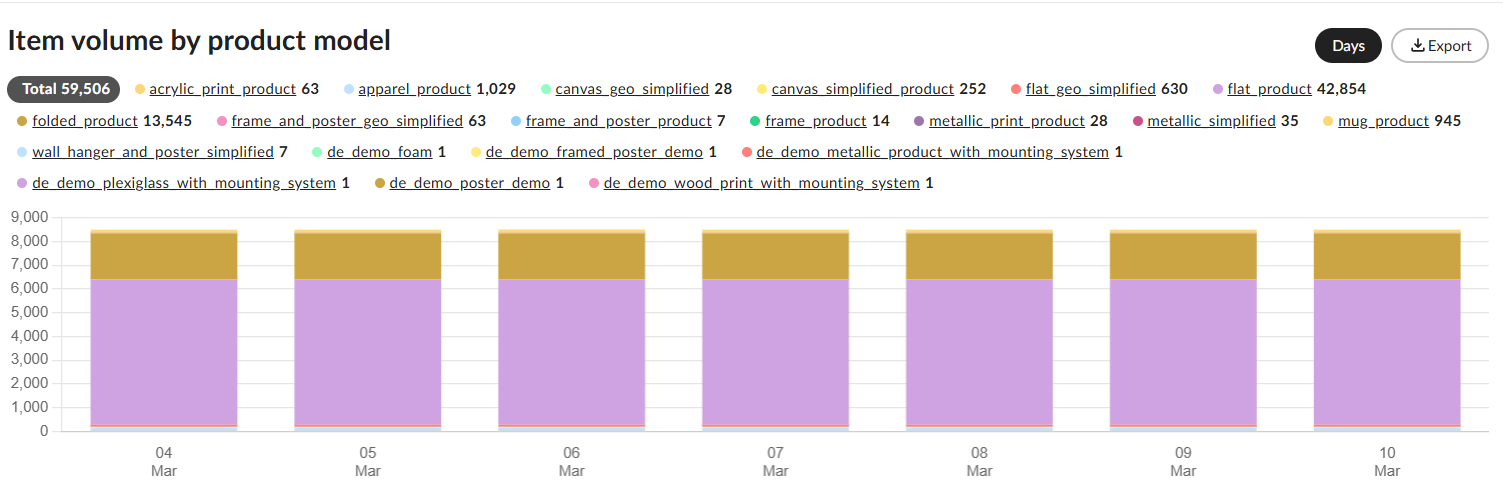
This overview helps you understand what is driving your profit, which products are sold the most, and which ones may need more marketing or attention. Such reports give you an option to decide what will be your focus in terms of products and what kind of investments in terms of equipment you want to make.
SLA Performance
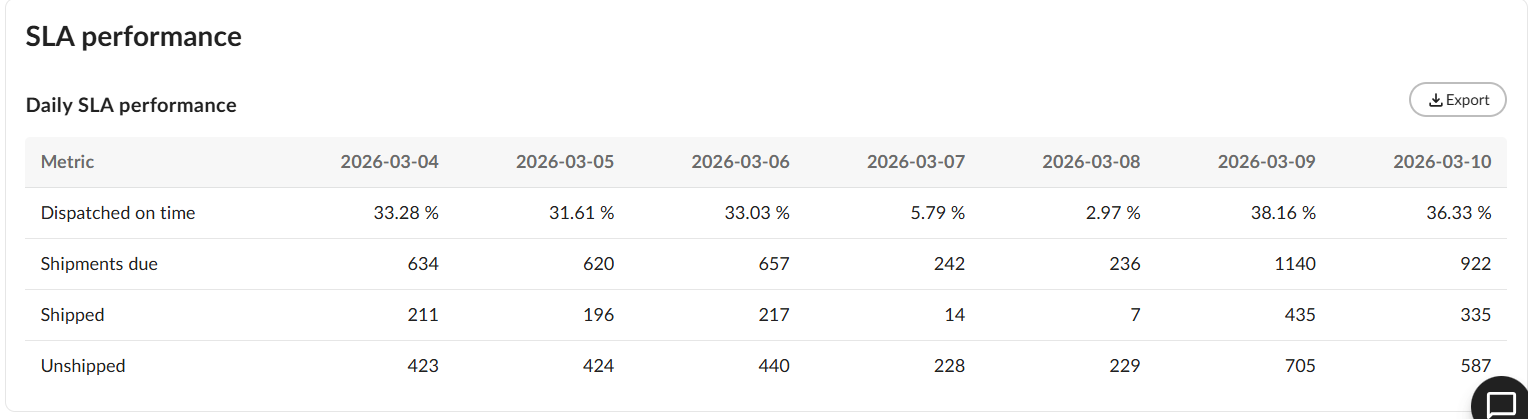
Check if your team is shipping orders on time and check their overall performance. With this hard data, you can either praise your team or prepare an improvement plan to meet your deadlines by noticing patterns in the decrease in performance.
By turning performance monitoring from guesswork into data-driven decisions, you'll build a stronger print network and keep your customers happier.